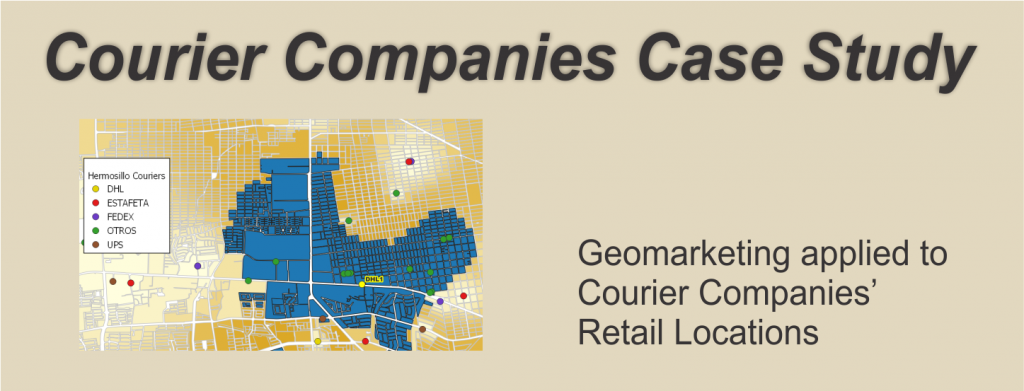
In this article Courier Case Study we show how Geomarketing processes, together with demographic data from recognized sources, can be applied to the business environment.
This case study focuses on the analysis of retail locations, using the example of courier companies, with a methodology applicable to any other line of business.
You may also be interested in our MiniMarkets Case Study in which we address retail site location.
Retail Site Analysis per Municipality and Economic Activity $ 11,990.00 MXP. For more information please contact us
Introduction
One of the ways in which courier companies attract customers is through retail locations where the public goes to make their shipments, personal or business.
This case study focuses on applying Geomarketing tools to establish how the geographic factor influences the performance of retail locations, identifying opportunities that cannot be appreciated in any other way. We will see, from a geographical approach:
- What is the market potential of a retail location?
- How does competition influence market potential?
- Identify unserved areas
- What happens when incorporating a new retail location in the territory, whether it is your own or that of the competition?
- How can the market potential be compared with the actual retail location performance?
We use data from the Population and Housing Census, as well as the DENUE data base which is part of the Economic Censuses, in addition to a series of parameters of the Courier services.
Study Zone
The city of Hermosillo, Sonora was randomly selected. Taking information from INEGI’s DENUE data base as of May 2022, there are 61 companies under the activity code 492110 which corresponds to “Foreign Courier and parcel services”.
For the purpose of this study, we identified 4 of the best-known companies located in the city, which are, in alphabetical order:
- DHL (8 retail locations)
- Estafeta (10 retail locations)
- FEDEX (4 retail locations)
- UPS (6 retail locations).
- The rest of the companies were classified as “Otros” (others, 33 retail locations).
Customers looking for courier services can be individuals or companies. The location of this potential market can be obtained from the Population and Housing Census data, as well as from the Economic Census, both at the AGEB (Mexican Census Tract) and block level.
For people, it was considered that the clients are of legal age, so that the population over 18 years of age was taken.
For businesses, again using the DENUE data base, a derived layer shows the number of existing businesses for each block in the city. By business it is meant any economic unit regardless of its line of trade.
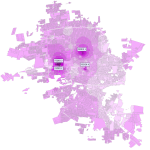
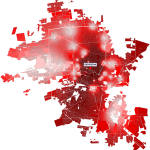
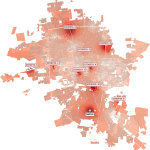
In this map you can see the location of the courier companies with the classification indicated above, together with the two layers of potential clients, people over 18 years of age and the number of companies, at the AGEB level.
Note: In the maps of this study, we use color scales to represent indicators in such a way that the higher the value, the darker the tone of the color used. On a mobile device, we recommend viewing in landscape orientation.
Now we will calculate the probability that a customer will go to a point of sale considering how attractive it is, the distance it is located and the effect that the competition has on that acquisition.
What is the market potential of a retail location?
The Huff Model is one of the most recognized tools to identify the potential market around a retail location. This model calculates the probability that a customer would prefer to go to a certain retail location, considering these factors:
- The retail location attractiveness as perceived by the customer.
- The distance from the customer’s location to the point of sale.
- Other similar outlets in the study area
Attractiveness Degree
Several factors can influence whether a courier’s point of sale is attractive to a potential customer. According to our experience with courier companies and in addition to the distance, these are some of them:
- Staff Customer Service
- Fast attention
- Quality of the premises
- Nearby parking
- Facilities to move large or heavy packages
- Types of shipment (national, international)
- Business hours
- Price
To measure the attractiveness degree of a retail location, it is necessary to conduct customer surveys to find out which features they consider attractive and which are not. To maintain consistency and homogeneity in the results, both own customers and those of the competition must be studied.
With the results of the surveys, a single indicator is generated that encompasses all those parameters measured for each of the study points, which will be used as an index of degree of attraction.
Distance between customer and Retail Location
The distance from each point to the location of the potential market is made using a Geographic Information System. Depending on the database used to determine the location of the customers (AGEBs or blocks in the case of Mexico), the distance from each one of them to the retail locations that will be studied is calculated.
For this case study, the City of Hermosillo has 15,328 blocks with census data, so when calculating the distance from each of them to the 61 retail locations, a matrix of 61 x 15,328 records, totaling 935,008 entries is obtained.
From the AGEB point of view, there are 538 in Hermosillo for a total of 32,818 records calculated records.
Huff Model Results
The model calculates the probability that a potential customer will visit each of the retail locations included in the study, in our case a total of 61 courier units located in the City of Hermosillo.
When the process is applied to each of the blocks, the result looks like this, taking the DHL1 point as an example (a similar result is obtained for each point within the study as shown later in this study):

Using the same practice of color tones, the darker parts indicate a greater probability that a customer located in that block, whether person or company, decides to go to the point of study, in this case DHL1. The lighter parts show an area where a customer is less likely to do so.
Zooming in on the location of the point, we can have a better appreciation of the result of the Huff model, where the shades and probability values around the DHL1 point calculated for each block are clearly appreciated.


Lighter areas indicate a lower probability that a customer will go from their location to the place of study, in this case DHL1. Low probability values are strongly influenced by the presence of the closest competition.

Thus, CLENTE 1 (Customer 1) in this image has a 22% probability of going to the DHL1 point (even when it has other nearby options), than CLIENTE 2 (Customer 2) with a 3% probability both due to distance and the presence of other closer courier companies.

The following interactive map shows the same block-level analysis for example points from the study’s Courier services, in alphabetical order.
The study points were identified as DHL1, ESTAFETA4, FEDEX4 and UPS6, which are close to each other and allow the results of applying the Huff model to be compared.
Selecting a block will display the corresponding probability. On a mobile device, we recommend viewing in landscape orientation.
Courier Coverage Potential
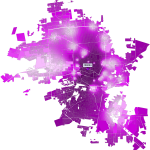
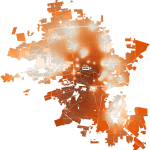
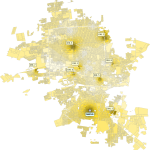
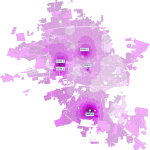
It is also possible to determine the potential territory of the retail locations network of each courier, obtaining a broader vision of the environment studied. These images show the distribution of customer potential areas for the entire City of Hermosillo for each of the couriers that are part of this study (click on the image to enlarge):
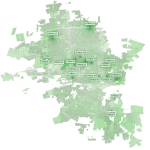
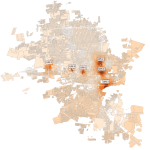
With this, a competitive analysis may be done, that is, to evaluate the coverage of the companies that are competitors in relation to the potential of the total market of the city.
Potential market size based on census data.
Calculating the size of the potential market based on the demographics of the customers sought for (people over 18 years of age and number of business units) is done by multiplying the probability that a customer will attend a given point of sale, by the size of the market in each block.
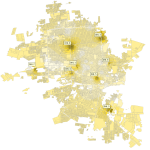
Continuing with point DHL1 for reference, this image shows the potential customers over 18 for each block (those in white do not have data for that demographic value):

With a potential full coverage total of 16,723 people over 18 years of age.
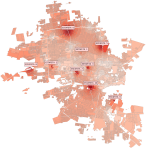
And for business units, the potential is as seen in this image overlaid on the Companies by block layer (the ones in white do not have data for that demographic value):

With a potential to capture 1021 companies for its full coverage.
These images show the potential customer acquisition area for the 4 points that we have used as an example in this study: DHL1, ESTAFETA4, FEDEX4 AND UPS6 (click on the image to enlarge):
And this is a comparison of potential customers for each one
| LOCATION | OLDER THAN 18 | BUSINESS UNITS |
|---|---|---|
| DHL1 | 16723 | 1021 |
| ESTAFETA4 | 11248 | 549 |
| FEDEX4 | 8103 | 585 |
| UPS6 | 8969 | 660 |
Identify Areas with Growth Potential
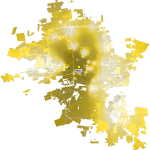
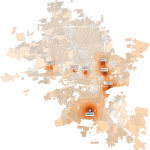
By analyzing the Courier Coverage Potential images shown above, it is possible to identify areas with lack of coverage based on light tones.
The current location of the existing retail locations, show there is a marked tendency to give preference to the central and south-eastern areas of the city, leaving opportunity areas to the northwest, as well as the southern region.
This image shows those areas where, after carrying out other complementary studies, it could be feasible to create a new retail locations.

By adding a new retail location identified as NUEVA (New) in ZONE 4 shown in the image above, we will be able to assess the overall impact it would have on the market.
To study the effect of this new retail location, in these images we show how it would impact each of the main couriers in this study, simulating that it is added to their network (click on the image to enlarge):
This table shows a comparison of the potential increase in the market both in people over 18 years of age and in companies (on a mobile device, we recommend viewing it in horizontal orientation):
| COURIER | CURRENT OLDER THAN 18 | NEW OLDER THAN 18 | % INCREASE | BUSINESS CURRENT | BUSINESS NEW | % INCREASE |
|---|---|---|---|---|---|---|
| DHL | 113722 | 130104 | 14 | 6404 | 7174 | 12 |
| ESTAFETA | 168356 | 183015 | 8 | 9063 | 9751 | 7 |
| FEDEX | 66057 | 84592 | 28 | 3563 | 4440 | 24 |
| UPS | 82406 | 98981 | 20 | 6132 | 6910 | 12 |
How can you compare the market potential with the actual customer acquisition of a point of sale?
Again, using the DHL1 point and assuming that the real location of a representative sample of customers at the point of sale is known, through the sender’s addresses, the blocks to which the addresses belong are identified and therefore where the users come from.
In this way we can compare real customers with potential areas and establish advertising and marketing actions in areas where there is no real coverage or it is low based on potential.
This image simulates in blue the actual coverage obtained as an example for this retail location, with the market potential in the background. Let us remember that the darkest areas of market potential mean a high probability that customers will go to the retail location studied. In this example we see several areas with these characteristics from which no customers have been captured.

Summary and Next Steps
We have seen how the combination of different data and Geomarketing tools give a new vision of a business, based on the impact that its geographical location has.
The result of this type of study is a complement to other known marketing techniques that can support decision-making for questions such as:
- How do we extend the customer coverage of our retail locations?
- Where and what type of advertising should we carry out?
- Shall we open, relocate or close a point of sale?
It is very important to have as accurate a customer profile as possible. This depends on information that a company collects from those who use its services. This study was carried out under the assumption that any person over 18 years of age or any type of business makes use of Courier services, but the real case may be different.
Additional information such as age, sex, education, line of business, type of shipment (personal or business), destination of the shipment (national or international), among many others, will allow market segmentation according to the company’s operations.
In the case of courier companies, there are other ways of attracting customers, such as the shipments collection, so similar studies could be carried out to locate where the collections are requested from and thus complement what is obtained from direct sales through the retail locations network.
Customer mobility studies can complement the results of the study. For example, it is possible that a person goes to a point of sale not necessarily near their residence, but one that is in the way of daily commutes and that is more convenient.
Contact us so we can explore the benefits that these tools can bring to your business.