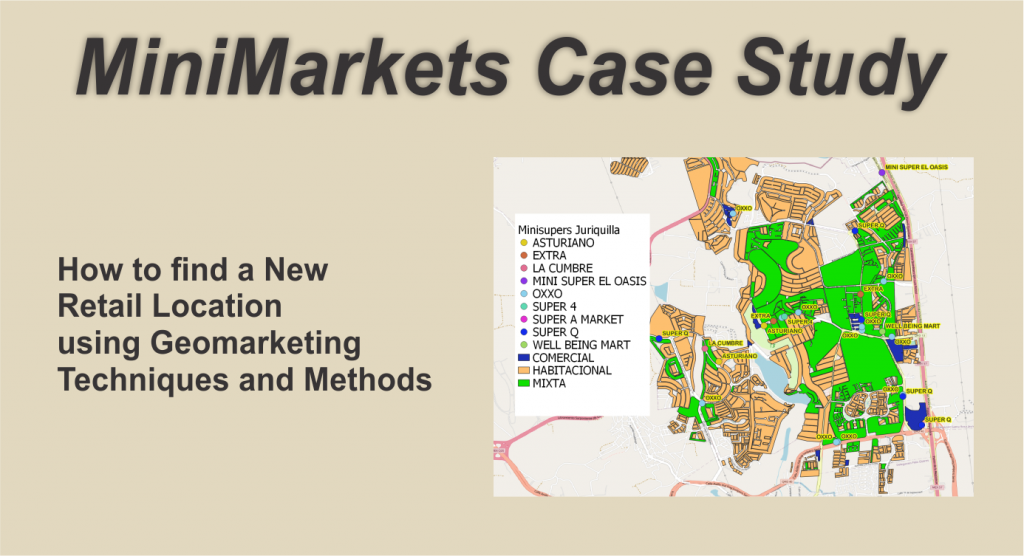
In Minimarkets Case Study we apply Geomarketing techniques for the location of a new retail point.
The study area is the neighborhood of Juriquilla in the city of Querétaro, the State of Querétaro, Mexico, analyzing the current environment of Minimarkets, also known as Convenience Stores.
Retail Site Analysis per Municipality and Economic Activity $ 11,990.00 MXP. For more information please contact us
Introduction
Juriquilla is located northwest of the city of Querétaro, a region that is constantly growing from a residential and commercial point of view. With more than 40,000 inhabitants and 2,400 people whose jobs are in that locality, there is a potential market of over 42,400 people, in 699 blocks for which census information is available.
According to data from the economic censuses, economic activity code 462112 that corresponds to “Retail trade in Mini-supermarkets” , also known as Convenience Stores, as of May 2022 shows the following retail points in the area:
| NAME | BUSINESS UNITS |
|---|---|
| Asturiano | 3 |
| Extra | 2 |
| La Cumbre | 1 |
| Mini Súper El Oasis | 1 |
| Oxxo | 11 |
| Súper 4 | 1 |
| Súper A- Market | 1 |
| Súper Q | 6 |
| Well Being Mart | 1 |
This map shows the establishments location within the study area.

Market Profile
The Minimarkets market is made up of people who both live and work in the neighborhood. We identify where those who live in the area are located, as seen on this map

and those who work in it

The blocks in black denote that there are no people in it, neither residents nor people who work in them.
By combining both coverages, a map of the total number of potential clients (inhabitants added to the staff working in the area) was generated and they were classified in colors, with the darkest tone representing the blocks with the greatest potential clients and in shades clear where there is less.
Similarly, each block was classified as follows:
- Residential in which there are only residents, there is no economic or commercial activity.
- Commercial where there is economic or commercial activity but no residents.
- Mixed containing both inhabitants and economic or commercial activity
- Without Population in which there are neither residents nor economic or commercial activity
Overlaying the establishments on top of these Market Profile classifications, we can see their relationship with the market location. With this we can start the process of selecting a suitable place to open a new convenience store in the area.


Also, as additional information for this study, we can identify the areas of economic concentration by creating a map where the location of commercial establishments in Juriquilla may be seen.

The objective of this case study is to locate a retail point in which a Minisuper can be installed, with the largest possible market penetration.
Candidate Identification
Using Real Estate Internet pages, 5 commercial areas were found that offer premises for rent that can be used to install a mini-supermarket:
- Juriquilla Shopping Center
- Jurica La Campana
- Plaza Paseo San Isidro
- Plaza Amarraz
- Plaza Cubos
whose location is shown in these images in relation to the classification by block type as well as the demand


Parameter definition
The following parameters and considerations were made for this study.
- People would be willing to walk 500 meters from their location to go to a convenience store, which is equivalent to a 5 minute travel time approximately.
- By car, the distance considered is 1000 meters, with an approximate travel time of 3 minutes.
- Demand is the measure of the market that can potentially go to the retail point. In this case, it is the number of people in each block, both residents and those who work in them, as seen in the image of total people per block shown above.
- We will look for a commercial premises located in such a way that it maximizes the number of customers who may come to the Mini-supermarket within a coverage area of 750 meters in all directions, which is the intermediate value between traveling by car and walking.
In Geomarketing this is known as a Coverage Maximization Process, a model that seeks to access the greatest demand for each candidate point considering a target distance from the market. The optimum location point would be the one where the market potential is the greatest for the distance studied.
Thus, we will identify which of the 5 candidate sites has the highest customer potential within the radius of 750 meters around each one, by executing the Coverage Maximization Process, both for the candidate points and for the existing ones.
Then we will validate the resulting selection, making a comparison with the competition.
Study Results
Using the GIS software, the Coverage Maximization Process is excecuted

This table shows the results for the 5 candidate locations in which it is seen that the location in Jurica La Campana has the greatest market potential with 4,372 people in the range of 750 meters around the point.
| CANDIDATE | DEMAND |
|---|---|
| JURICA LA CAMPANA | 4372 |
| JURIQUILLA CENTRO COMERCIAL | 3792 |
| PLAZA AMARRAZ | 3751 |
| PLAZA CUBOS | 2863 |
| PLAZA PASEO SAN ISIDRO | 1182 |
By including the results of the already existing Convenience Stores, we can see the potential market size that they now have and compare it with the potential of each study point. We can see that there are 11 convenience stores that have greater market capture potential than the best positioned candidate.
| CANDIDATE | DEMAND |
|---|---|
| OXXO 3 | 6045 |
| OXXO 8 | 6045 |
| SUPER Q 5 | 5894 |
| OXXO 4 | 5695 |
| OXXO 10 | 5682 |
| OXXO 2 | 5347 |
| OXXO 11 | 5331 |
| OXXO 5 | 5314 |
| WELL BEING MART | 5276 |
| ASTURIANO 3 | 4498 |
| SUPER Q 3 | 4377 |
| JURICA LA CAMPANA | 4372 |
| EXTRA 2 | 4199 |
| SUPER 4 | 4176 |
| OXXO 7 | 4169 |
| SUPER Q 6 | 4169 |
| OXXO 6 | 4167 |
| LA CUMBRE | 4154 |
| OXXO 1 | 3974 |
| JURIQUILLA CENTRO COMERCIAL | 3792 |
| EXTRA 1 | 3771 |
| PLAZA AMARRAZ | 3751 |
| ASTURIANO 1 | 3716 |
| SUPER A-MARKET | 3052 |
| SUPER Q 4 | 3028 |
| PLAZA CUBOS | 2863 |
| SUPER Q 2 | 2204 |
| ASTURIANO 2 | 1927 |
| SUPER Q 1 | 1754 |
| OXXO 9 | 1513 |
| PLAZA PASEO SAN ISIDRO | 1182 |
| MINI SUPER EL OASIS | 829 |
Selecting Jurica La Campana would be the best option for which an attraction probability study is made.
This screen shot from the GIS software shows, in blue, the blocks within the 750 meter range from the Jurica La Campana candidate point as well as the associated attribute table on the right hand side. The table shows the block classification (TIPOMZA), the potential demand for a given block (DEMANDA) which is the total of inhabitants and staff working in it and finally, the distance from that block to the point (Dist_665290):

Measuring the Attraction Probability for the Selected Point
In Couriers Case Study, we explain the benefits of the Huff model, to measure the probability that a customer will go to a retail point based on how attractive it is in addition to the distance it is located.
The model is applied to both the Jurica La Campana retail candidate as well as the existing establishments to measure its attractiveness degree.
The results show probability values of up to 80% in the blocks immediately surrounding the candidate point, as seen in the image.

And here we can see the relationship with the nearby competition locations.

Again, in the GIS software, two new data columns have been added to the attribute table belonging to the blocks within the study range of 750 meters. Column PROB_CAMP shows the probability that a potential customer will go to the retail point as calculated by the Huff model.
Column DEMANDA_PROB shows the result of multiplying the potential demand (DEMAND) times the probability of customers coming (PROB_CAMP) resulting in the probable demand per block.
Adding them up totals 1,541 probable people visiting the studied retail point.

Final comments
Geomarketing provides supplementary information to other data sources to make business decisions. In this case, we identified which of the 5 candidate locations is the best option from the point of view of maximizing access to potential demand.
Afterwards, a comparison was made of the probability that a client would go to the new location, considering the influence of the competition, with attraction probability values for each block yielding and estimate of customer who may be visiting the candidate retail point.
However, when comparing the market size of the best candidate with other existing stores, some of them have up to 50% more potential, so it may be advisable to broaden the search for possible candidates that offer greater market advantages.
It is advisable to survey the existing points of sale and validate the information obtained from the DENUE. There is always the possibility that points of sale will open, close or change. A physical survey of the study area will ensure that all existing points are being considered.
The more accurate the information used to conduct the study, the better results will be obtained.
Retail Site Analysis per Municipality and Economic Activity $ 11,990.00 MXP. For more information please contact us