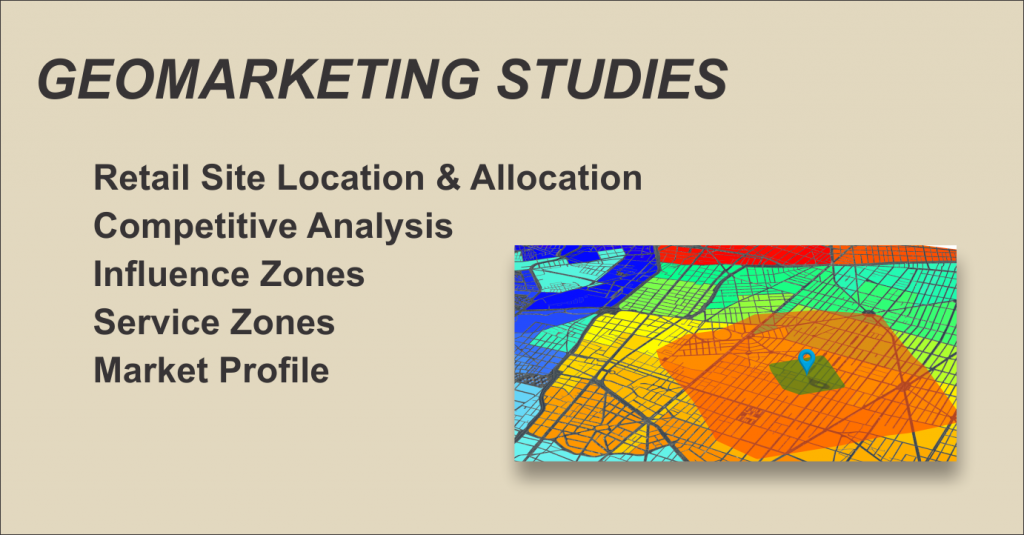
Geomarketing specialists in
Retail Site Location & Allocation
Competitive Analysis
Influence Zones
Service Zones
Market Profile
Retail Site Analysis per Municipality and Economic Activity $ 11,990.00 MXP. For more information please contact us
Mapping your business… in a different way
Geographical Information Systems merge with Marketing to provide a great set of tools to improve business performance.
Are you aware of the impact that geographic location has in your business results?
Understanding how the geographical environment impacts the performance of your company will allow you to identify new business opportunities and improve results.
Discover where and how many customers come to your business
Learn about the social, demographic and economic characteristics of the areas where they come from, transferring the great diversity of census data available in Mexico to a geographical context
Identify other areas with similar characteristics close to your business that will allow you to increase your market share, designing campaigns focused on attracting new customers, taking into account the location of your competition and how it impacts your business.
Geomarketing is a tool that, combining traditional marketing information with Geographic Information Systems, allows a spatial focus to be given to the behavior of a business, identifying opportunities and risks that are difficult to detect in any other way.
Stand out from your competition by integrating, in a geographical context, data from formal sources such as economic and socio-demographic censuses with the information generated by the company itself, creating previously unidentified opportunities.
With Geomarketing, give your business a new dimension
Retail Site Selection & Allocation
Find the best location for your new Retail Site by analyzing candidate options applying recognized Geomarketing techniques which can also be used to assess current location market penetration. Our Minimarkets Case Study shows a detailed example on how these techniques are applied in a real scenario.
Competitive Analysis
Geomarketing techniques and methods allow to understand how the geographic factor influences the performance of retail locations, identifying opportunities that cannot be appreciated other way. Assess from a geographical approach:
- What is the market potential of a retail location?
- How does competition influence market potential?
- Identify unserved areas
- What happens when incorporating a new retail location in the territory, whether it is your own or that of the competition?
- How can the market potential be compared with the actual retail location performance?
- Apply demographic data for market profiling and identify where customers are.
Our Couriers Case Study shows how these techniques and data sources are applied to existing business conditions.
Influence Zones
A Geomarketing methodology to know where your customers are coming from.
It consists of generating an area or perimeter around the site location that encompasses the territory from which they come.
A frequently used approach was to create so-called Circles of Influence based on a defined radius around the site location, within which most customers were supposed to come.
This approach lacks high accuracy and credibility as there is no solid data backing it up.
The most accurate methods are derived from information generated by the business itself, obtaining data such as the postal code, neighborhood and even the street from where customers come.
The accuracy of the information can be planned based on the characteristics of the business.
For example, for parcel and courier companies, data at a zip code or neighborhood level may be good enough.
Retail sales points such as convenience stores or bank branches would have a better benefit with a street or block level.
The information obtained will then be used to identify both where your customers come from and in what quantity, transferring it to a geographic information system.
In this way, you will have a visual representation of the territory covered by your retail site, unattended areas with growth potential, analyze phenomena such as the so-called “cannibalism” in which your own sales points compete each other.
The zone of influence of a retail site provides a solid basis for knowing how its location may be impacting business results and identifying improvement options.
Service Zones
If you have a shipment based business, you can optimize its performance with a service zone analysis.
The range that your delivery system can support based on route travel distance or time, as well as the type of vehicle used, may be accurately studied.
In the case of distance, one method consists of generating circles around the retail point with a diameter that corresponds to the ranges to be investigated.
The service polygons method uses the real distances of the road system, generating an irregular shaped polygon that represents each of the parameters studied.
Finally, a third method is based on the streets network around the retail point as well, and directly identifies individual streets for each distance range studied.
Time-based service zones are calculated using the period of the route being studied and taking into account the delivery method to be used such as walking, cycling or motorized vehicle.
Factors such as speed limits and street one way are considered, as well as the applicable speed according to the means of transport considered for the shipments.
Regardless of the method used, by superimposing them on a Geographical Information System, considering the business own customer data and relating them to information from population and economic censuses, a great diversity of data may be extracted covering each of the identified zones such as Population, Business Units, Employees and Homes among many more direct and derived census metrics, allowing to know the profile of customers within the delivery zones.
In this map we can see these cases with the polygon generated for walking distribution, followed by bike delivery and finally the case of a car or motorcycle.
The layers are:
- The Reatail Site
- Streets at 500 m and 1000 m distance from the site
- Time based Service Zones at 5 and 10 minutes for walking, bicycle and car.
This table shows the scope within the generated service area for the car/motorcycle for 4 data fields derived or extracted from census data:
| FIELD | 5 MIN | 10 MIN |
|---|---|---|
| 18 YO or older | 266,417 | 1,153,119 |
| Business Units | 26,284 | 120,765 |
| Employees | 399,178 | 1,503,835 |
| Households | 150,519 | 568,123 |
Market Profile with Demographics
Demography data is widely used in Geographical Information Systems applications such as in Geomarketing to create customer profiles, urban planning, mobility planning, social studies among many others. Data from various census and statistical studies such as the Population and Housing, Economic Census and Housing Inventory are the major components used for Demography.
In Demography we explain how these data sets are used for Geomarketing. Actual usage can be seen in our Couriers Case Study and Minimarkets Case Study.