Introduction
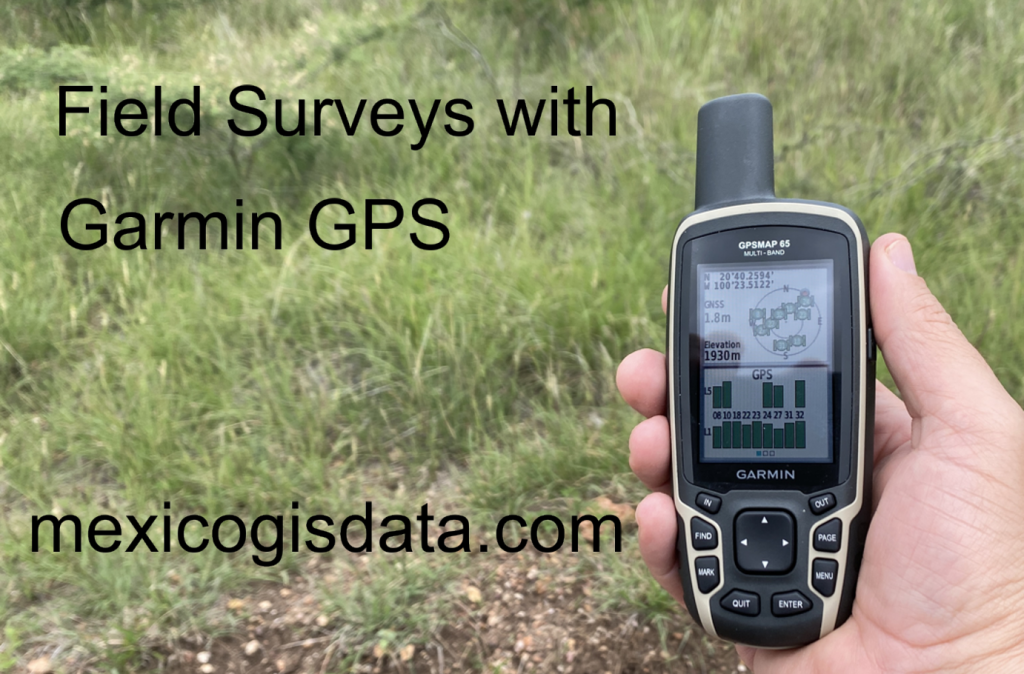
The eTrex and GPSMAP series devices are widely used to perform Field Surveys with Garmin GPS when a 1 to 3 meters precision is good enough considering the final use that will be given to them. Some outstanding applications are Surveying, Archaeology, Delineation of fish farming areas, forestry development among many others in which the survey of points, lines and areas are an important factor in some activity.
The data collected in this way is eventually transferred to a geographic information system for further processing.
The Garmin eTrex and GPSMAP series accessibility make them ideal for cost-effective data capture.
In this Field Surveys with Garmin GPS user guide, we provide a detailed explanation of the concepts, configurations, and methods that will allow you to obtain the expected results in an efficient and practical way.
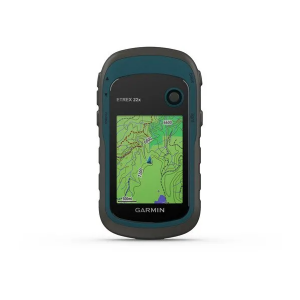
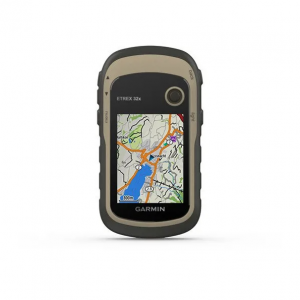
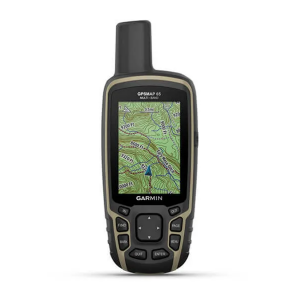
We used an eTrex 32x and a GPSMAP 65 for its development. The GPSMAP 65, having the option to use GNSS and multichannel, allows obtaining precise coordinates in environments where reception can be affected by vegetation, buildings and other objects that hinder the reception of satellite signals.
To get the most out of this guide, we highly suggest reviewing the Important GPS Concepts section as it explains a number of terms and facts that are important to this guide.
Note: The images below were captured with the GPS set to Spanish but the text contains the menu descriptions in English.
Accuracy
These devices allow to obtain an accuracy around 1 to 3 meters. This means that the actual position of the device will be within a circle with a radius of 1 to 3 meters (2 to 6 meters in diameter) around the obtained coordinate.

So, they should NOT be used in applications that require sub-meter accuracy.
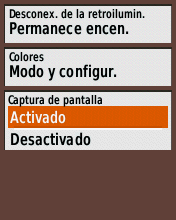
Screen Capture Option
Some of the processes that we will describe below provide momentary data that cannot be stored on the device. Such is the case of the “Area calculation” and “Waypoint Averaging” screens.
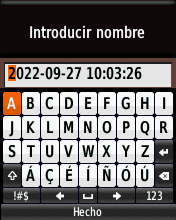
One option to keep a record of them is to take a screenshot, which will store an image of the device’s screen at the time the option is activated, which can then be downloaded to a computer.
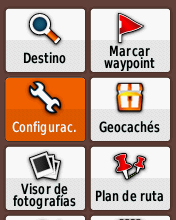
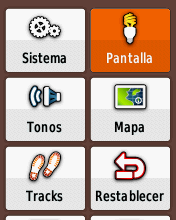
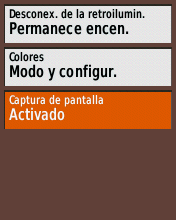
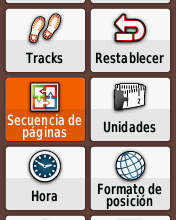
To activate the screenshot, you have to go to “Setup”, select “Display” and in the option that appears at the bottom, “Screen Capture” select “Activate”.
Objects in GPS vs. Vector Objects in GIS
These GPS devices are designed for recreational use and navigation using waypoints, which are points, as well as tracks and routes, which are lines. These objects are stored in the GPS memory in a format known as a GPX file, which is the one that is downloaded to be processed in Geographic Information Systems.
On the other hand, geographic information systems in vector data use points, lines, and areas. Given that GPS surveying is commonly used in determining areas, it is necessary to use the data capture options available in the GPS that allow them to be processed to convert them into areas, as we will see later.
GPS Screens used for Field Surveys
A series of screens available in the GPS menus allow to carry out the surveys, which we describe below.
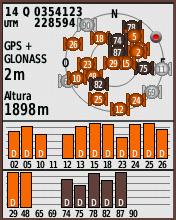
Satellite Screen
It is very important, before processing a survey, to check on the satellite screen that there is signal reception, that the GPS has calculated a position coordinate and to see the precision that is being obtained at that moment.
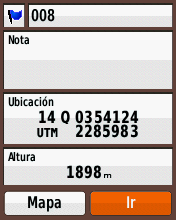
Waypoint Creation
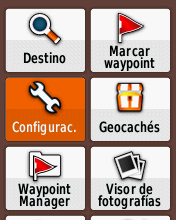
There are several tools that allow you to save a location as a waypoint. Both eTrex and GPSMAP have a “Mark Waypoint” option on the main menu.
On the eTrex series you can also hold down the joystick for a couple of seconds and the save waypoint screen will appear. And on the GPSMAP 65 you have a “Mark” button on the panel, which also opens the save waypoint window.
Using any of these options will save the waypoint to the accuracy currently displayed on the satellite display.

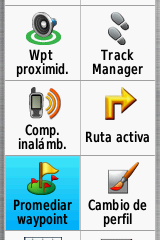
Higher location accuracy may be obtained using the menu option labeled “Waypoint Averaging”. This option obtains a location by averaging the position calculations generated by the GPS providing a higher degree of reliability and waypoint accuracy. It may take up to about 3-5 minutes to generate a location and waypoint with this method, depending on the geometry of the satellites.
Tracks
Tracks can be used to survey linear objects as well as area delimitation.
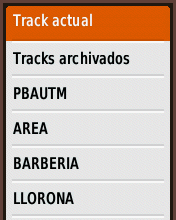
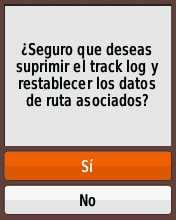
These types of devices are pre-programmed to start recording a track from the moment it obtains a location after turning it on. For this reason, it is very important to delete the “Current track” before starting a survey.


Using the normal track function, as soon as you get an initial position, all you have to do is traverse the border of the area to be surveyed. The GPS will generate the track with which the profile of the area to be surveyed is obtained. Once finished, it must be saved in memory with a representative name for post processing.
The devices have a second area measurement option called “Area Calculation” whose use we detail later.
GPS Setup for Surveys
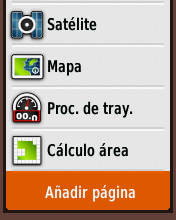
Considering the above, it is convenient to configure the GPS to have quick access to the most used pages or tools in this type of surveys, which are:
- Satellite Screen
- Map
- Waypoint Averaging
- Area Calculation
- Waypoint Manager
- Track Manager
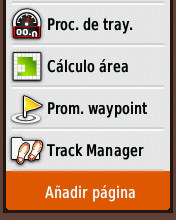
These options are distributed throughout the main menu in the default configuration, so accessing them requires many keystrokes. There is a way to configure them so that they appear directly in the sequence of computer screens. On eTrex, this sequence is accessed by pressing the upper right “back” button. In GPSMAPs it is accessed with the “Page” button.
To set up the page sequence on both an eTrex and GPSMAP, do the following:
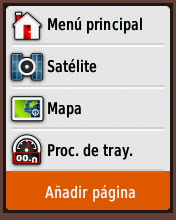
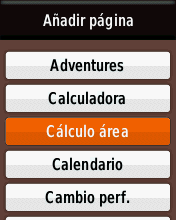
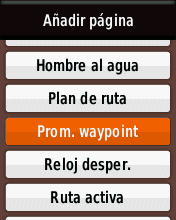
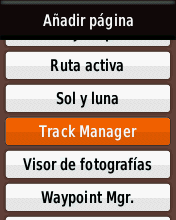
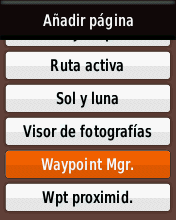
Go to “Setup”, select “Page Sequence” and at the bottom you will find the “Add Page” option. By pressing it you will see a list of available screens. Select the ones we have identified so that you can easily access them.

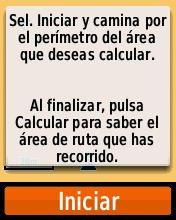
“Area Calculation” Screen
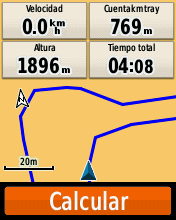
When selecting this screen, it will ask to move around the perimeter of the area to be measured, with which a track will be generated around it.
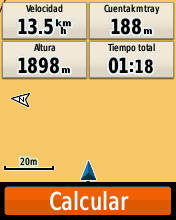
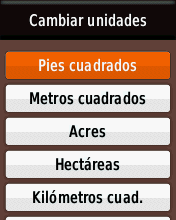
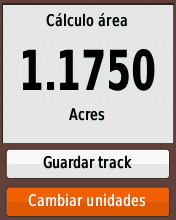
When stopping the measurement, it will indicate the value obtained from the area with a series of buttons to change the measurement units. It is important to mention that, if the final point of the area measurement does not coincide with the initial one, the device will join them with a straight line to close the polygon and make the calculation.
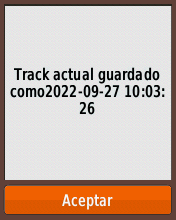
This is a momentary measurement so when you exit the screen, the calculation will be lost. We have an option to store it in memory as a track, which, although it will not have the calculated area information, can be downloaded to a geographic information system for post-processing.
This is the suggested sequence to use this screen is:
- Check the Satellite Screen to confirm signal and accuracy
- Delete current track in Track Manager
- Select the “Area calculation” tool
- Start calculation to get the measurement result.
- Optionally take a screenshot of the result, remember that it is the result cannot be stored.
- Save Track to device (does not save area data) for later processing.


Track Around Area
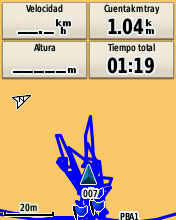
Similar to the previous case, but without using the “Area Calculation” screen. This simply consists of surrounding the study area with the device generating a track without calculating the area.
This is the suggested sequence to use this screen is:
- Check the Satellite Screen to confirm signal and accuracy
- Delete current track in Track Manager
- Select Map screen
- Circle the study area until you return to the starting point.
- Optionally, capture waypoints as added information.
- Save Track to device for later processing.
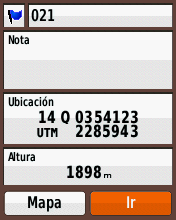
Waypoints Around Area Perimeter
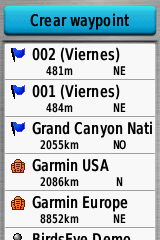
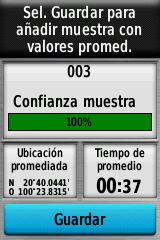
In this method, waypoints are created that represent the perimeter of the area to be measured. The best option to increase the precision of the measurement is to use the “Waypoint Averaging” screen, which, remember, will take 3 to 5 minutes to generate the most precise location possible considering the location of the satellites at the moment.
It is important to mention that it is convenient to plan the nomenclature of the capture points, especially if more than one zone will be measured in a single session. For example, identify each zone with a letter such as A, B, C, etc. followed by the consecutive of points, that is, A1, A2, A3, etc. until the polygon is complete. The second would have the sequence of points B1, B2, B3, etc. likewise until the polygon is completed.
The proposed sequence of steps is as follows:
- Create your point capture plan.
- Check the Satellite Screen to confirm signal.
- Even when a track will not be used to collect data, it is convenient to delete the current track in Track Manager.
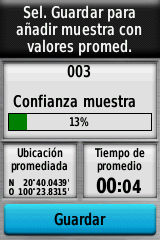
- Access the “Waypoint Averaging” screen and select “Create Waypoint”.
- Wait for the “Sample confidence” to reach 100%, it can take several minutes.
- Optionally capture screen to record accuracy
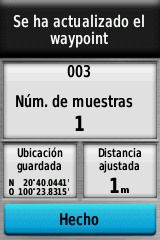
- Save the waypoint with the assigned name
- Move to the next point
- Repeat steps d, e, f and g
- Repeat the process at each of the planned points

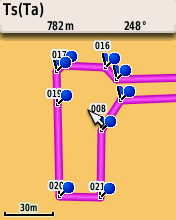
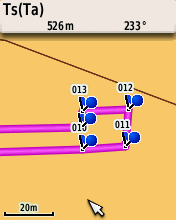
Optionally, it is possible to create a route following the sequence of the captured waypoints, which allows to see the delimitation of the area on the device screen and the generation of the final polygon is somewhat simplified when downloading it in a Geographic Information System.
If your GPS has preloaded maps included, it will be necessary to configure that route creation is made without considering the existing roads in it.
To do this, go to the “Setup” menu followed by “Routing” and set “Lock on road” to “No”.
Note: If GPS is also used for navigation, it will be necessary to return this option to “Yes” for the device to make a correct route selection.
The steps to follow for this option are
- Configure the routes to be carried out without considering existing roads as mentioned above.
- In the main menu select “Route Planner”
- Select “Create Route”
- Click on “Select 1st point”
- Select “Waypoints”
- Select the first point in the sequence in which they were captured
- Select “Use”
- Press “Select Next Point”
- Repeat sequence e, f, g and h until all points are included
- At the end of the last point. Press the “Back” button that will return to the list of routes.
- The new route will appear as “Route XXX” where XXX is a numerical sequence according to those stored in memory.
- By selecting the new route, it can be renamed and viewed on the map which will give us a clear picture of the recorded area.
The surveying method to use depends of the irregularity of the profile of the area to be studied. The one that best allows to record it shall be selected. If there are relatively straight areas, the perimeter waypoints method is probably the most practical. If there are many irregularities or curves, then the track method may be more practical, since the point method would require capturing many of them. Sometimes, having data from both options might be optimal.
Transfer GPS Data to a Geographical Information System (GIS)
The method used to transfer GPS data to a GIS platform will depend on how it handles these type of files. Some have interfaces that allow direct access to the files while others require an intermediate conversion process.
For the purposes of this guide, we will use the Geographic Information Systems program known as QGIS to manage GPS data since it has direct access to them in a way that is easy and fast to process.
Note: This guide is not intended to be a QGIS tutorial, but just to show the use of GPS data in a GIS program.
When the GPS saves data in GPX format, it inserts a prefix to the file name, distinguishing whether it is waypoints, tracks or routes. Regardless of the coordinate format set in the GPS, GPX files are always in WGS84 Datum with latitude and longitude coordinates, so they will be downloaded to the GIS software this way. Datum and coordinate format can be changed in the GIS platform if so desired.
Additionally, Garmin devices do not mix data types in the files. That is, we will not find waypoints combined with Tracks for example.
A survey of the same area was carried out using all the methods described so that results comparisons can be made.
The process used is as follows:
Connect the GPS devices to the computer and copy the working files to a specific folder for the project. There are 4 files with the following names:
- Track_2022-09-27 100326.gpx which contains the track generated using the “Area calculation” screen.
- Track_2022-09-27 101855.gpx contains the track generated at the same time the waypoints were captured.
- Waypoints_27-SEP-22.gpx are the points captured around the study area.
- Ruta_2022-09-27 113548.gpx with the route generated in the GPS following the sequence of captured points.
We start QGIS and from the GPS console we access the GPX files

We select the file to download. Depending on the method used to capture the region of interest, multiple files may need to be opened. Even though the GPS device will only include one type of data in the GPX file, QGIS is prepared to open all 3 types if they are combined. We open Track_2022-09-27 100326.gpx

We select the type of track data using the name assigned by the GPS as a guide. We repeat the process with other types of files that have been captured in the session.

With the data in the GIS software, we can do several processes.
Creating Areas from Points
Using the waypoints layer

With the QGIS tool “Points to Path” we join all the points and generate the profile of the area. We make sure to generate a closed route.

With the “Lines to polygons” tool we generate the polygon and process the object to obtain its area and perimeter.


Area Creation from Tracks and Routes
It is a similar process to the previous one but it does not require the first step of joining the points, as this type of file already contains the joining lines. So it is only necessary to use the “Lines to polygons” tool, generating the polygon and then calculating its area and perimeter.
This image shows the area generated from the track using “Area Calculation”

And in this we see the one generated using the route created in the GPS

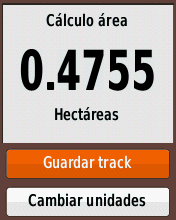
Making a comparison of the “Area calculation” method, the GPS obtained a value of 0.4755 Ha while the value calculated in QGIS using the track it generated is 0.4731 Ha.
Similarly, the polygon generated by joining the points in QGIS has an area of 0.5242 Ha, while the one generated from the route created in the GPS is 0.5241 Ha.
A GIS system allows adding other types of attributes to assign information that describes the properties of the polygon according to its use. For example, in farm fields there may be a parcel number, crop type, amount of fencing needed, fertilizer and irrigation usage estimates among many others.
It is also possible that other types of data represented by lines and points have been captured, such as division lines, irrigation pipes, sampling points, buildings, warehouses, among many others, which can be added to the GIS and generate detailed maps of the study area.
Creating a GPS Compatible Map with the Processed Data
It is possible to convert the processed data to a GPS device compatible map containing all the details of facilities and assets in the study area, even with a search option.
This can be very useful in forestry and forest development, for example, in which vegetation specimens are usually identified, which can be integrated into a map that facilitates their location in the field.
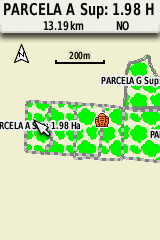
This is an example of a field survey of sowing parcels. Of the total of 7 of them, 6 were registered with waypoints and one using the track method. This image shows the data already loaded into QGIS

Processing the data with the explained methods, the polygons corresponding to the 7 parcels were generated.

The polygons were processed to convert them to the vector map file format used by the eTrex and GPSMAP series devices. In addition to the parcels identified by their name and surface measurement in hectares, other objects such as roads surrounding them, a construction in the center as well as a water reservoir within the study area were added.
This is how it looks in the GPSMAP 65
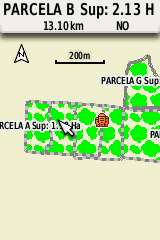
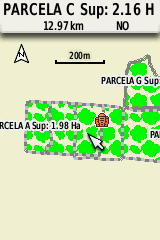
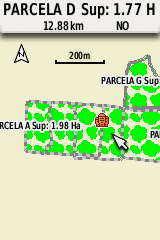
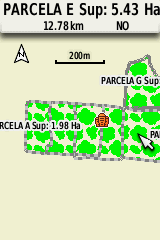
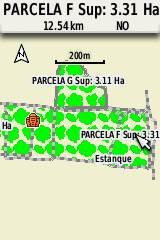
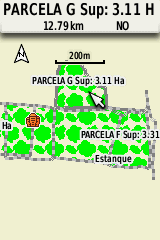
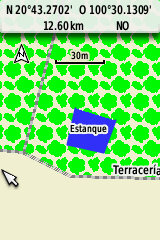
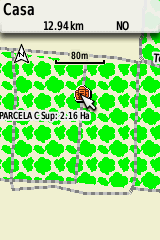
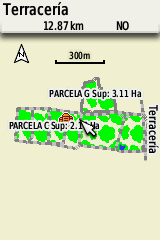
It is possible to add all the necessary details to represent in detail the study area and to be able to use it in the same devices used to collect the initial data.
At Mexico GIS Data we can develop custom maps compatible with Garmin eTrex and GPSMAP series devices using data collected in the field following the methods described in this article, as well as incorporating data from a company’s Geographic Information System if you have them.
Our Mexico GPS Geological Map is an example of our mapping projects.
Contact us for more information on this option.