Mexico Market Intelligence at the Resolution You Actually Need
Hyper-local demographic and business segmentation, with Socioeconomic Level and Dominant Business Activity — block by block.
If you are expanding into Mexico or working to better understand its evolving markets, you are likely facing a common roadblock:
Traditional datasets do not go deep enough.
Most data is only available at the postal code or AGEB level — far too broad for precision targeting in urban or mixed-use areas. Whether you are building Geomarketing models, planning retail networks, or identifying high-potential B2B clusters, that lack of granularity puts your strategy at risk.
Who is this for?
This dataset is designed for decision-makers and analysts in:
- Retail & Franchise Expansion – especially international companies entering or growing in Mexico
- Market Research & Media Planning – agencies seeking micro-segmentation
- B2B Sales & Logistics – teams locating potential client concentrations or delivery points
- B2C Product & Service Marketing – businesses aiming to target by income level and neighborhood type and local economic conditions.
The Problems You’re Facing
- Your Mexico data is too coarse – limited to postal codes or AGEBs
- No reliable way to distinguish between residential and commercial areas at a block level.
- Socioeconomic segmentation is difficult to access at a meaningful granularity.
- Business density and type are unclear at the block level
Our solution: true block-level insight
We provide a high-resolution dataset that combines demographic and business segmentation, designed to support both B2C and B2B use cases. The dataset includes:
- Block-level classification: residential, business, or mixed
- Population data, segmented by age and gender
- Number of dwellings per block
- AI-estimated NSE (Socioeconomic Level) per block, based on AMAI’s 2024 classification model
- Number of business units and estimated employees per block
- Dominant business activity, classified using SCIAN (NAICS) 3-digit codes
- Market potential indicators combining residents and employees in each block.
Format: Delivered in industry-standard SHP file format, ready to use in your GIS platform
Availability: Available per state or as a nationwide package
No subscriptions or proprietary tools required
What’s Inside the Dataset?
The block-level segmentation dataset provides an integrated view of Mexico’s residential and commercial landscape, enabling you to analyze population characteristics, business presence, purchasing power, and market potential — all in one place.
Each record corresponds to a single city block and includes the following fields:
Geographic Context
- State, Municipality, and Locality where the block is located
- Unique Block ID for internal referencing and integration
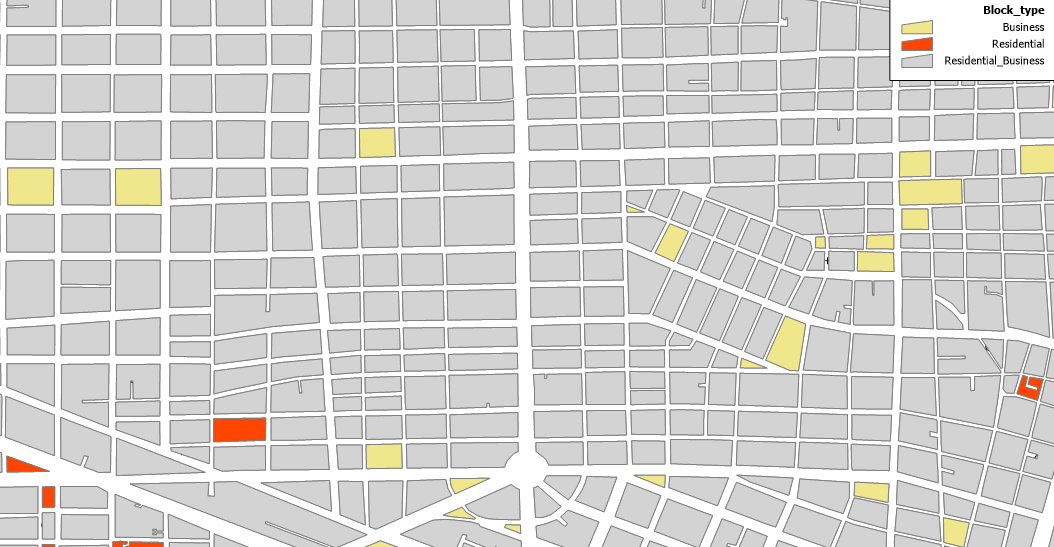
Block Classification
- BLK_TYPE – Identifies whether the block contains:
- Only Residential
- Only Businesses
- A combination of both
Population Structure
- POP – Total population residing in the block
- AGE_18MORE / AGE_17LESS – Breakdown between adults and minors
- Female population – Total, 18+ years, and under 18
- Male population – Total, 18+ years, and under 18
- DWELLINGS – Number of residential households in the block
Note: Some population features are only shown when 10 or more residents/dwellings per block are present, due to privacy restrictions.
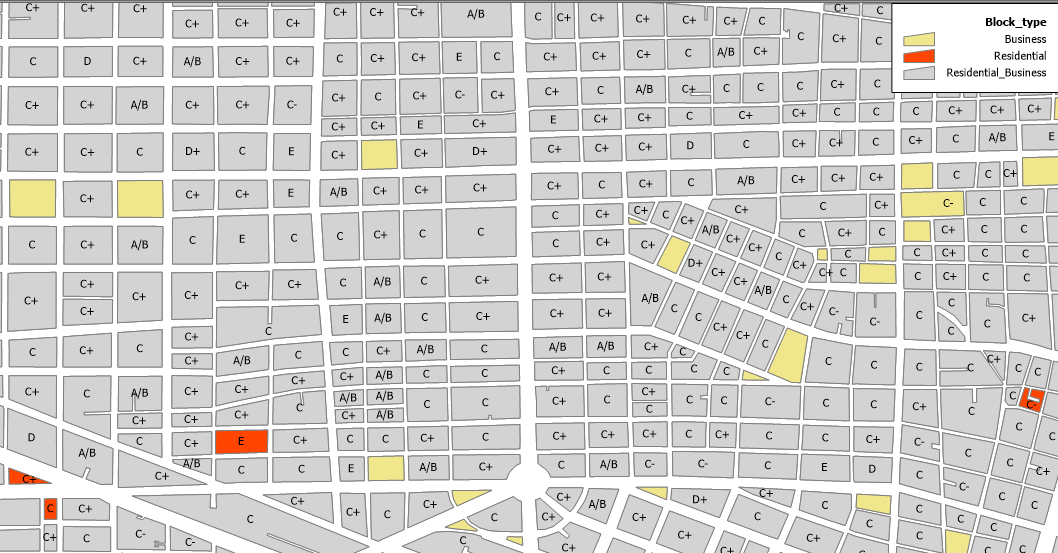
Socioeconomic Level
- NSE_LEVEL – Block-level estimate of the average socioeconomic level.
Calculated using a proprietary AI-supported algorithm aligned with AMAI’s 2024 model
AMAI (Asociación Mexicana de Agencias de Inteligencia de Mercado y Opinión) is Mexico’s leading market research association. - Their NSE model classifies households into seven levels, based on Education, housing conditions, access to services, and ownership of durable goods:
- A/B : Highest income level. Households with very high education, income, and full access to goods and premium services.
- C+: Upper-middle class. Comfortable lifestyle, good education and stable income, high access to modern amenities.
- C: Middle class. Moderate income and education, standard access to services and durable goods.
- C–: Lower-middle class. Below-average income, more limited access to services and goods.
- D+: Working class. Irregular or low income, basic living conditions, limited household assets.
- D: Low income. Very modest living standards, minimal access to services, basic infrastructure.
- E: Lowest income group. Extreme poverty, precarious housing, very low education and limited or no services.
This detailed segmentation allows you to:
- Target marketing efforts by purchasing power
- Align product offerings with consumer affordability
- Perform location intelligence with richer social context
Business Density & Workforce
- BUS_UNITS – Number of business units operating in the block
- EMPLOYEES – Estimated number of workers employed in those units
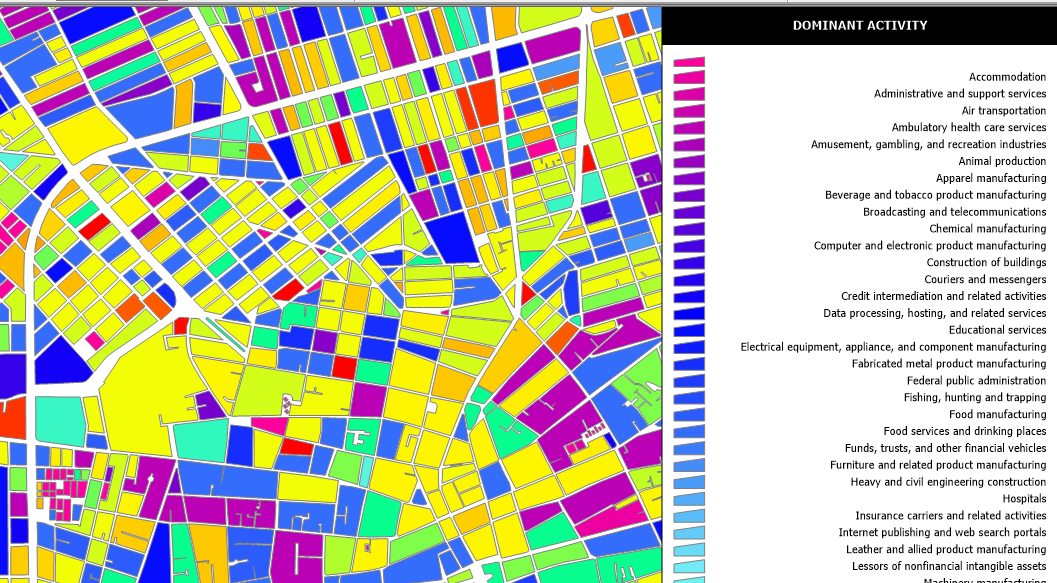
Economic Profile
- DOM_ACTIVITY – Dominant business activity in the block
Based on the number of business units classified by SCIAN (NAICS) 3-digit codes
Includes 91 business categories across retail, services, manufacturing, logistics, and more
Market Potential Indicators
- MAR_POT – Total market potential, combining the number of residents and employees in the block
Use this to estimate real foot traffic, local demand, or catchment area size - MAR_POT_18 – Adult market potential (residents aged 18+ plus employees)
Ideal for consumer-facing services or adult-targeted product segmentation
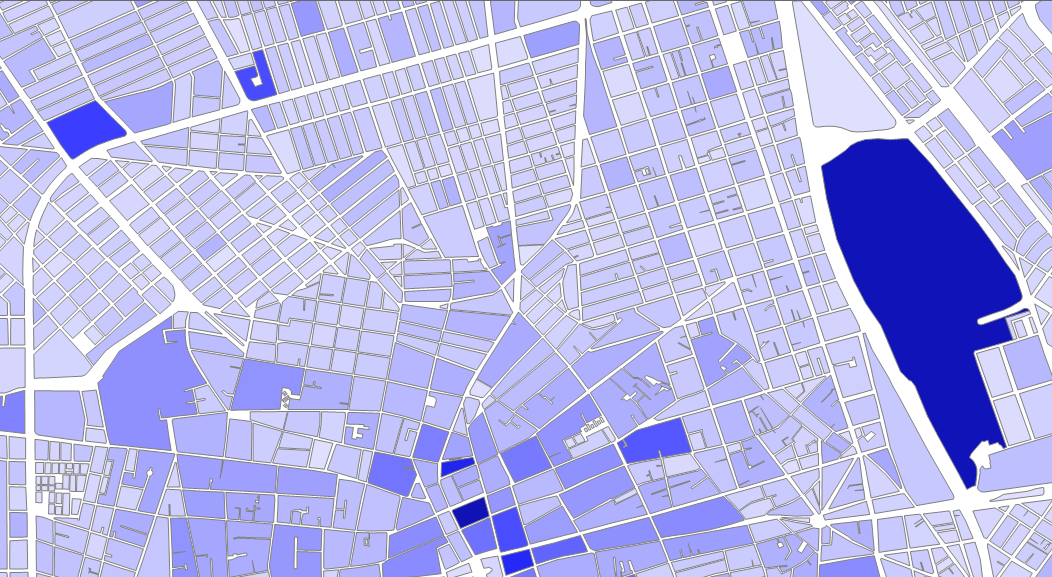
Visual Support and Optional Enhancements
To help you better interpret and communicate the data, we offer optional ready-to-use visualizations and maps for selected regions or the full dataset. These are especially useful for presentations, reporting, or internal analysis.
Available thematic layers include:
- NSE Level by Block – Visualize socioeconomic distribution neighborhood by neighborhood
- Block Type – Identify residential-only, commercial-only, and mixed-use zones
- Dominant Business Activity – Map the economic function of each block across regions
- Market Potential Heatmaps – Highlight blocks with the highest combined resident and worker density
Custom visualizations or sector-specific mapping (e.g., grocery, financial services, healthcare) can also be provided upon request.
Available Metro Area Datasets
$5,200.00 | ||
$5,200.00 | ||
$5,200.00 | ||
$5,200.00 | ||
$6,000.00 | ||
$5,200.00 | ||
$5,200.00 | ||
$5,200.00 | ||
$5,200.00 | ||
$5,200.00 | ||
$6,000.00 | ||
$6,000.00 | ||
$6,000.00 | ||
$5,200.00 | ||
$5,200.00 | ||
$5,200.00 | ||
$5,200.00 | ||
$5,200.00 | ||
$5,200.00 |
Format & Delivery
- File Format: ESRI SHP (Shapefile) – compatible with most GIS software and platforms
- Delivery: Via secure download link.
- License Scope: Available by individual state or as a national package
- No proprietary viewers, subscriptions, or locked platforms required
This is a data-first product — clean, accurate, and designed to plug directly into your GIS or analytics workflow.
Let Us Talk
Whether you are building a location strategy, identifying high-opportunity zones, or analyzing competitive footprints, our block-level segmentation data gives you the clarity and control you will not find in postal code-level sources.
Ready to evaluate a sample or request pricing?
We’ll gladly provide:
- A data preview for your region of interest
- Sample visualizations
- Tailored pricing based on your coverage needs
Contact us today to learn how this dataset can unlock smarter decisions for your business or clients.